Laboratory Results Portal
Your results do not just appear — they get prioritised
View your sample results, download TÜRKAK accredited and electronically signed reports, and track your facility’s hygiene performance. The new version goes one step further: where a problem is recurring, which point has not been sampled, and the file you will present to management — all ready.
- TÜRKAK accredited
- e-imzalı resmî belge
- Antalya & Likya

The screenshots are taken from the live portal; the facility name has been replaced for illustration.
The portal does not recalculate any result. The compliant / out-of-limit decision belongs to the laboratory; what the portal does is bring those decisions together across time and sampling point, and make them readable.

Not a list — a to-do list
The home page does not hand you a pile of reports. It shows three problem types separately, because each calls for a different action: new out-of-limit results from the last 30 days, problems recurring at the same point for the same parameter, and points that were sampled regularly but have gone quiet.
The list is ordered by priority and recency; each item states how long ago it occurred.

Which chart shows a point that was never sampled?
None — because there is no data there. The portal tracks that gap separately: points sampled at least three times but silent for more than 60 days are listed with how long they have been silent. Amber at 90 days, red at 120.
In an inspection the question asked is often not “are there bad results” but “is the monitoring continuous”.

Where is the problem recurring?
Points are rows, months are columns. Every darkening cell means an out-of-limit result at that point in that month. You see at a glance the difference between a one-off deviation and a point that has become chronic.
Seasonal patterns — pools in summer, stores in winter — become visible here.

The report says “compliant”. But is it completely clean?
If an analysis with a regulatory value of 20 cfu/ml returns 19, the laboratory’s decision is compliant — but there is growth. The portal shows this state separately in yellow; the row is marked as “growth below the limit”.
Yellow rows do not lower your success rate — the success rate looks only at out-of-limit results, which is the laboratory’s official decision. Yellow exists to draw attention before a problem grows.

The document for an inspection is the laboratory’s own
The portal does not redraw the report. The PDF you download is the official document itself, bearing the Ministry heading, the TÜRKAK accreditation statement, the registration number and the signatures — the whole protocol is electronically signed.
An unsigned, sample-level preview is also available for day-to-day use; the screen states which one goes to an inspection. The report button opens the moment the laboratory publishes the document.

Monthly management presentation: four steps, one file
Choose the period, pick the template (Corporate / Plain / Dark), tick which slides to include, then preview and download. A heading with no data arrives switched off and is skipped — no empty slides are produced.
The charts are not images. They arrive as PowerPoint’s own chart objects; you can change the colour, the title and the data labels to match your corporate template.
Your results open on the laboratory’s approval
Results appear in the portal automatically the moment authorised approval is given in the laboratory; no further action is needed from you. On average 5–7 days for general analyses, 10 working days for Legionella. Throughout that time your protocol is shown in the list as “under analysis”.
Each account sees only its own facility’s data. Because the same username may belong to different facilities at the two laboratories, the portal asks which laboratory at sign-in; a wrong choice cannot sign in.
Screens from the portal
-
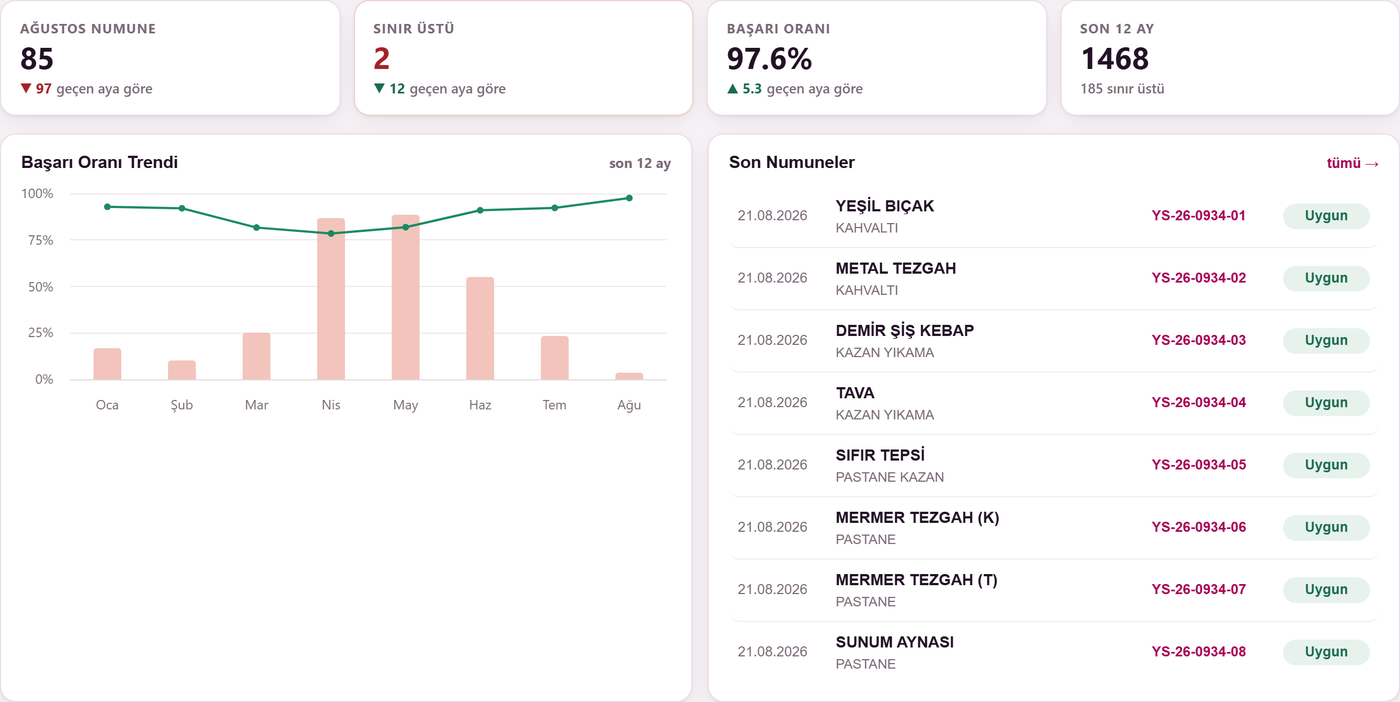
The month’s summary and the 12-month success-rate trend -
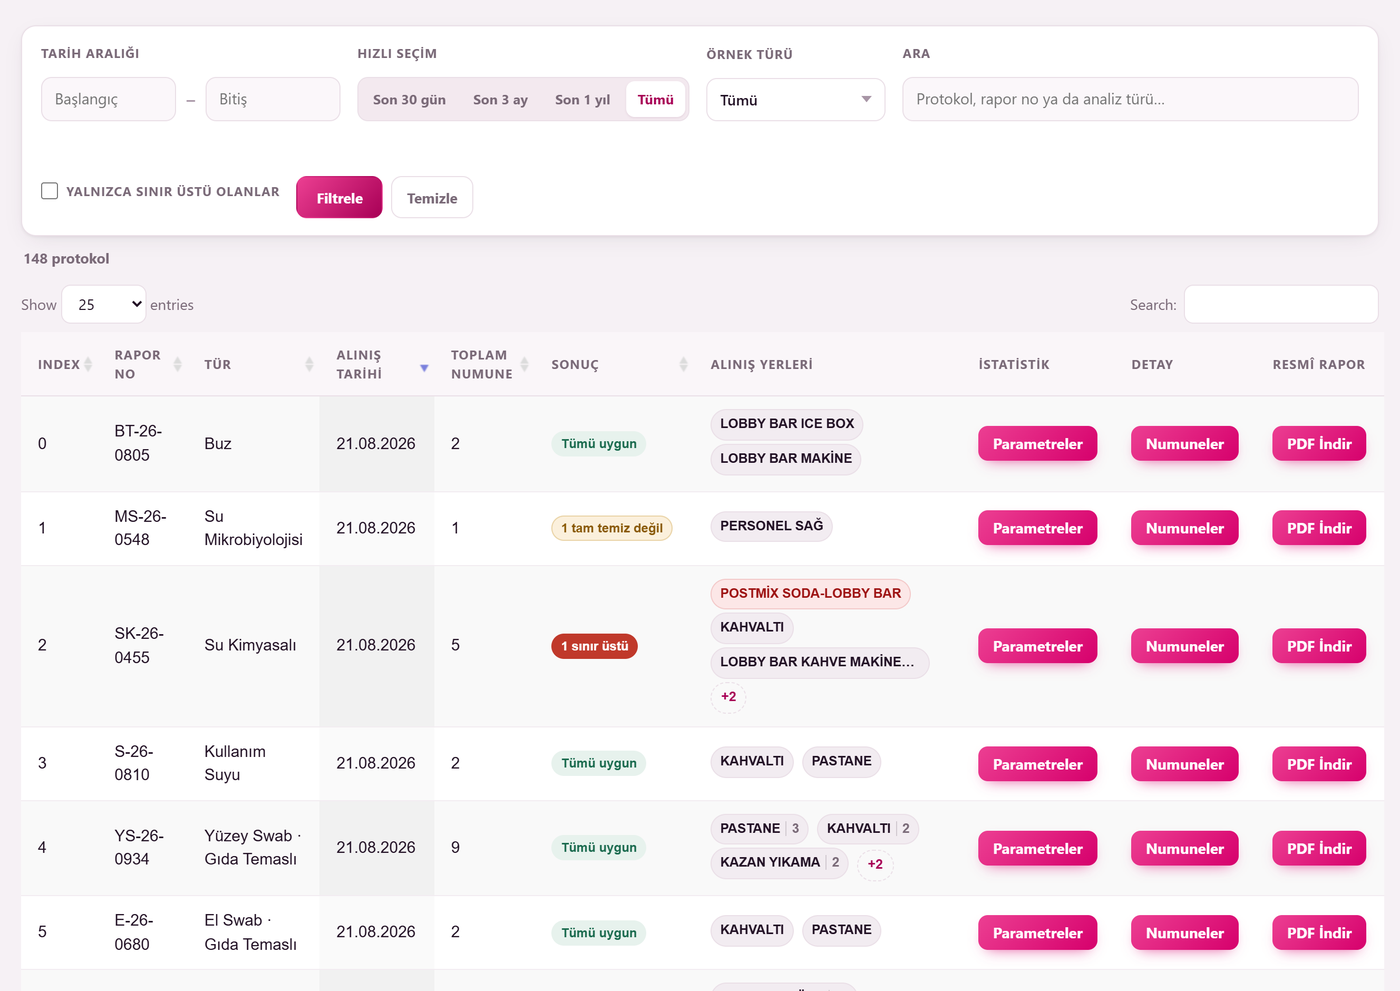
Filtered protocol list -
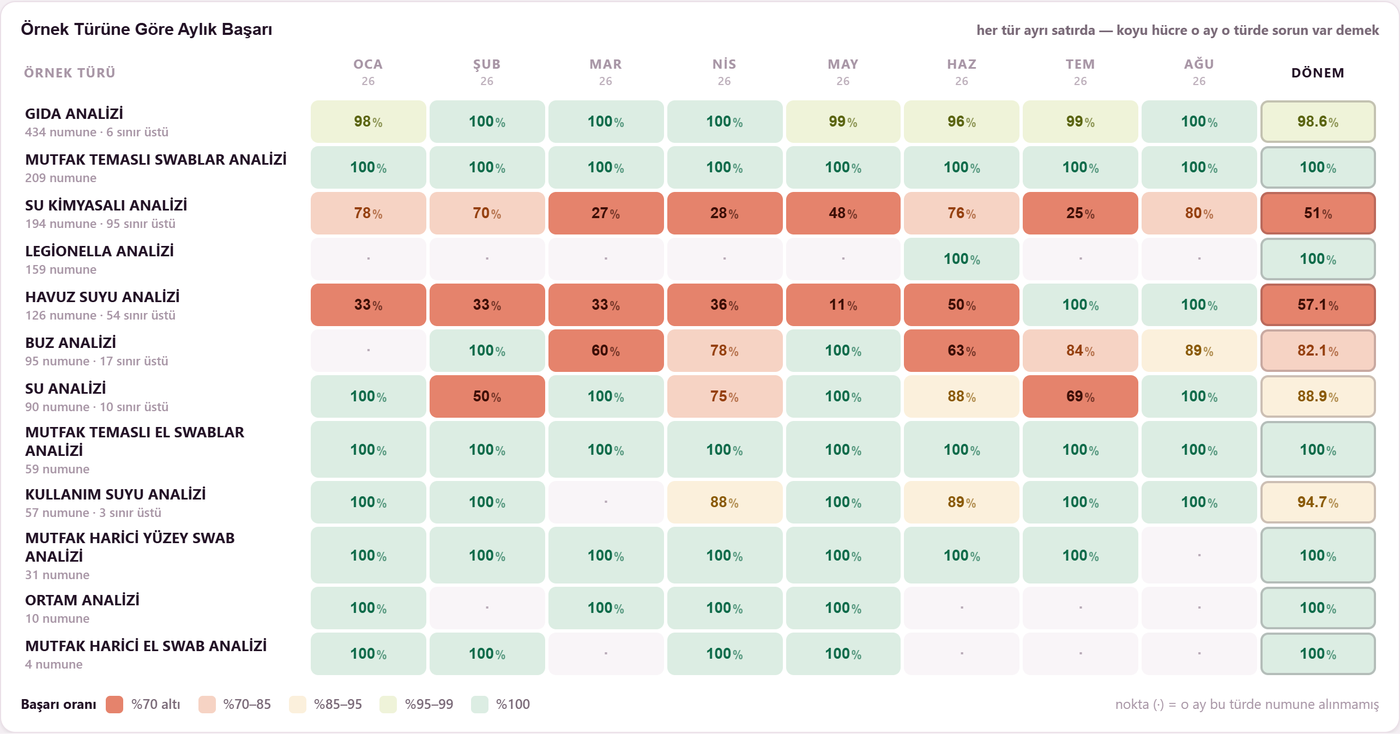
Sample type × month success heat map -

Distribution of out-of-limit results by facility area -
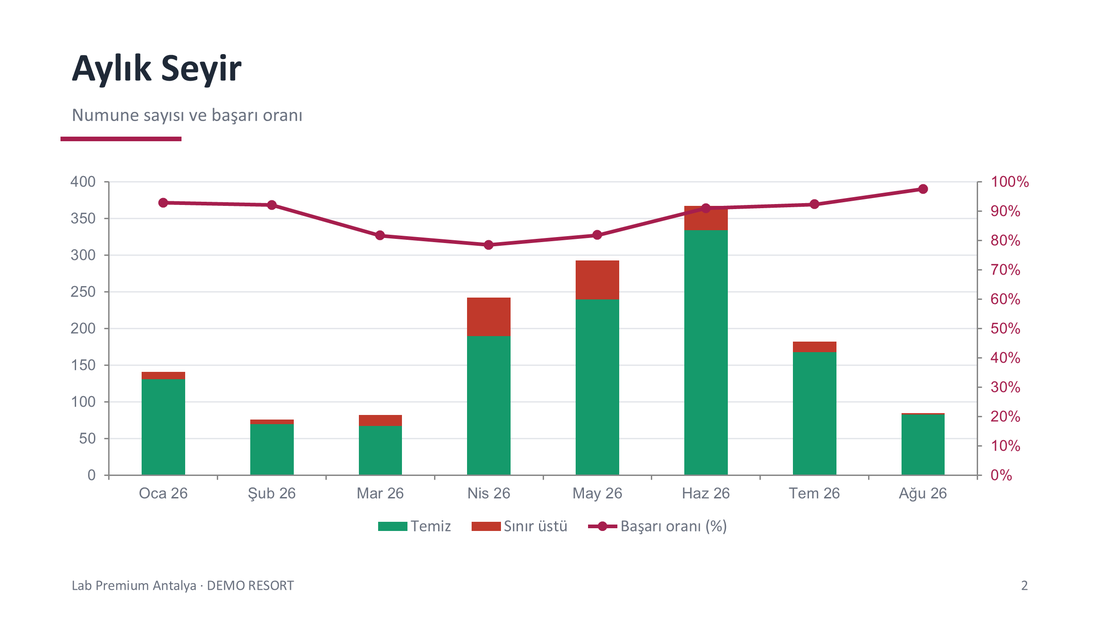
The Monthly Trend slide of the generated PowerPoint file — the chart is a real chart object


The screenshots are taken from the live portal; the facility name has been replaced for illustration.
Choose your laboratory and sign in
If you do not have an account, send a user request and your laboratory will open one.